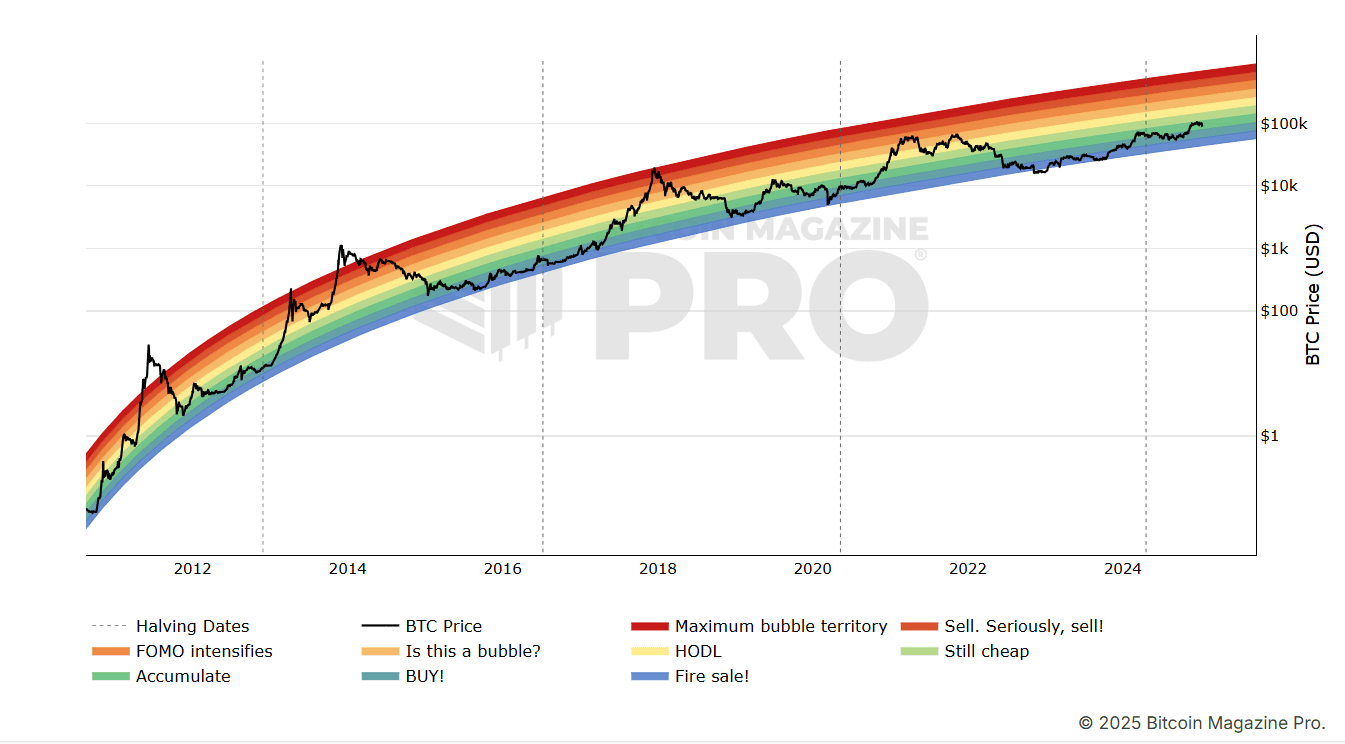
Imagine having a tool that helps you understand the best time to buy or sell Bitcoin. This is what the Bitcoin Rainbow Chart offers. But what exactly is it, and how can you use it to your advantage? In this article, we'll explore this fascinating chart, its history, how to interpret it, and some useful tips to make informed decisions in the world of cryptocurrencies.
What is the Bitcoin Rainbow Chart?
The Bitcoin Rainbow Chart is a visual representation of Bitcoin's price history that uses a series of colors to indicate different price levels and possible future trends. It was created by an analyst named Dominic Frisby and has gained popularity among investors for its simplicity and ease of use.
How Does the Rainbow Chart Work?
The chart is based on a regression model that uses historical price data of Bitcoin to project future price movements. Each color on the chart represents a price range:
- Red: Highly overvalued
- Orange: Overvalued
- Yellow: Neutral
- Green: Undervalued
- Blue: Very undervalued
These colors allow you to see at a glance whether Bitcoin is in a buying or selling period.
The History Behind the Rainbow Chart
Dominic Frisby introduced the chart in 2019 as a way to visualize Bitcoin's price history and provide visual context. Since then, it has become a popular tool among traders and cryptocurrency enthusiasts. The idea is that the chart not only helps predict trends but also makes information more accessible to beginners.
How to Use the Bitcoin Rainbow Chart
1. Access the Chart
The first step in using the Bitcoin Rainbow Chart is to find a reliable source that displays it. You can find it on various cryptocurrency analysis websites and trading platforms.
2. Interpreting the Colors
Each color on the chart has a specific meaning. Here’s a quick guide:
- Red: Avoid buying, as the price may drop.
- Orange: Exercise caution; the price may be overvalued.
- Yellow: A good time to evaluate your investment.
- Green: Consider buying; the price may be undervalued.
- Blue: This is a great opportunity to acquire Bitcoin.
3. Combine with Other Tools
While the rainbow chart is useful, you shouldn't base your decisions solely on it. It's advisable to combine it with other tools and analyses, such as technical analysis and volume indicators, to get a more complete view of the market.
4. Review Regularly
Bitcoin prices can change rapidly. It's essential to check the chart regularly to stay updated on trends and adjust your investment strategies as needed.

Advantages of the Rainbow Chart
1. Simplicity: The visualization is easy to understand, even for beginners.
2. Historical Context: Provides a frame of reference that helps assess price trends.
3. Visual Predictions: Facilitates identifying buying and selling opportunities.
Disadvantages of the Rainbow Chart
1. Not Foolproof: Like any analysis tool, it does not guarantee accurate results.
2. Temporal Limitation: It is based on historical data, which may not reflect future trends.
3. Lack of Depth: Does not offer in-depth analysis of external factors that may affect price.
Tips for Investing Using the Rainbow Chart
1. Do Your Own Research
Always research before making investment decisions. The rainbow chart is just one tool in your arsenal.
2. Be Patient
Don’t get swept up in market volatility. Use the chart as a long-term guide.
3. Diversify Your Portfolio
Don’t invest all your capital in Bitcoin. Consider diversifying into other cryptocurrencies and assets.
4. Stay Informed
Follow news and events that could influence Bitcoin's price and adjust your strategies accordingly.
Conclusion
The Bitcoin Rainbow Chart is a valuable tool for anyone looking to better understand Bitcoin's price behavior. Through clear and simple visualization, it allows both beginners and experienced investors to make more informed decisions. Remember, while it is useful, you should always complement it with other analyses and tools to maximize your opportunities in the world of cryptocurrencies.
With this guide, you now have the tools you need to start using the Bitcoin Rainbow Chart in your investment strategy. Explore, learn, and make smart decisions!
