Have you ever wondered how cryptocurrency experts analyze the market? What do those lines and numbers on the charts mean? If you're a beginner, this guide will help demystify the art of reading crypto charts. Learning to interpret these charts is crucial for making informed decisions about your cryptocurrency investments. Let's dive in!
The Initial Intrigue: Why Read Charts?
Imagine you're in a guessing game. If you don’t know the clues, it will be tough to guess correctly. Crypto charts are your clues. They allow you to understand the story behind each coin, see how its value has changed over time, and anticipate possible future movements. But how do we do this? We’ll explain step by step.
Here is a beginner's guide to technical analysis.
What Are Crypto Charts?
Crypto charts are visual representations of price movements of a cryptocurrency over time. They can show you various types of data, such as:
- Price: How much the cryptocurrency costs at a specific moment.
- Volume: How much has been traded over a certain period.
- Time: This can range from minutes to years.
Types of Charts
There are several types of charts you may encounter:
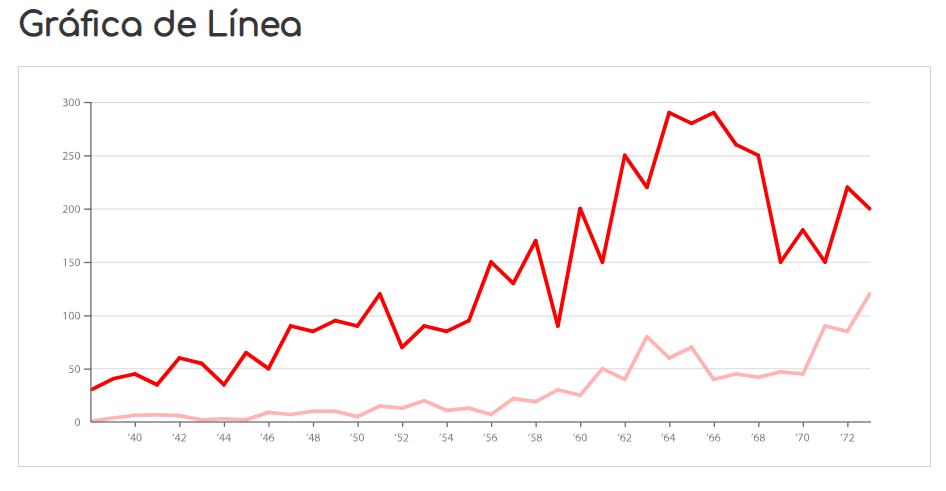
1. Line Chart
This is the simplest type. It shows the price of the cryptocurrency over time with a continuous line. It’s easy to read, but it doesn’t provide much information about intraday movements.
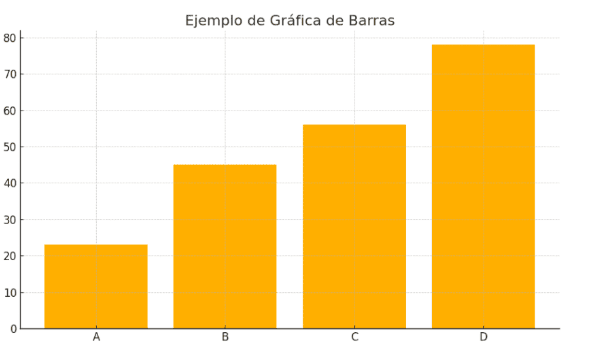
2. Bar Chart
It shows the opening, closing, maximum, and minimum price of a specific period. Each bar represents a time interval, and its height shows the difference between the highest and lowest price.
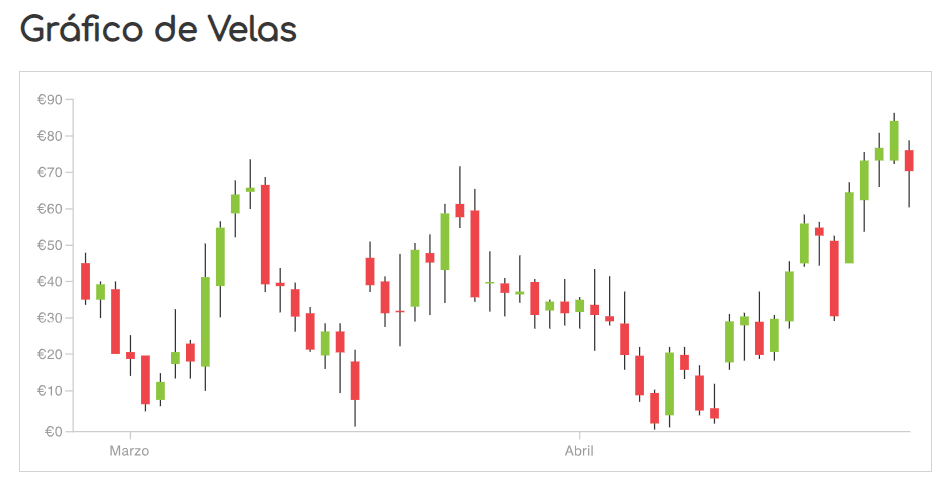
3. Candlestick Chart
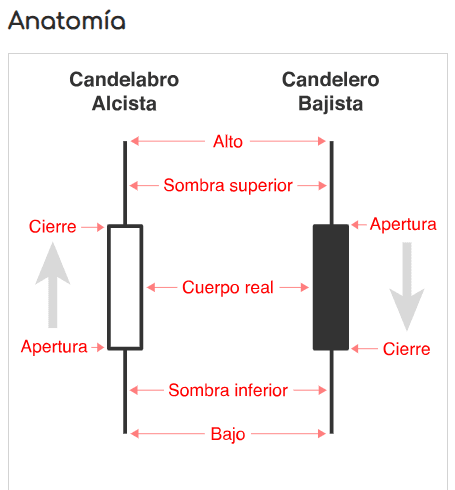
This is one of the most used charts. Each "candlestick" represents a time period and shows the opening, closing, maximum, and minimum price. Candles come in two colors: green (or white) indicates the price has gone up, while red (or black) indicates it has gone down.
Key Elements of Charts
To read crypto charts, you should familiarize yourself with some key terms:
1. X and Y Axes
- X Axis: Represents time. This can be in minutes, hours, days, or weeks.
- Y Axis: Represents the price of the cryptocurrency.
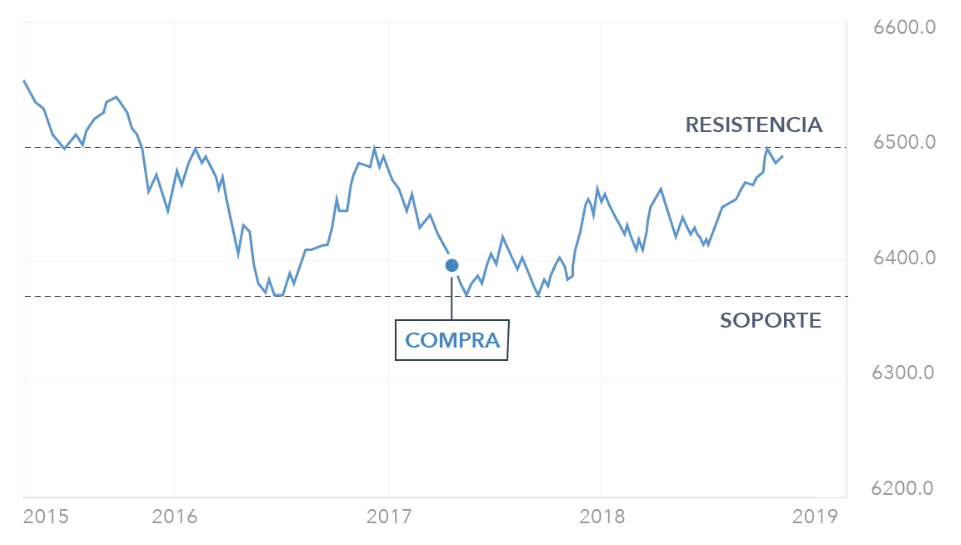
2. Support and Resistance
- Support: A price level where the cryptocurrency has difficulty falling below. It acts like a "floor."
- Resistance: A level where the price struggles to rise above. It acts like a "ceiling."
3. Volume
Volume indicates how many units of the cryptocurrency have been traded in a period. High volume can indicate strong interest, while low volume may suggest the opposite.
How to Read a Candlestick Chart
Now that you know the basics, let's see how to read a candlestick chart:
1. Identify the Candle: Each candle gives you information about the opening and closing price.
2. Interpret the Color: If the candle is green, the price has risen. If it's red, it has fallen.
3. Look at the Shadows: The lines extending from the top and bottom of the candle indicate the highest and lowest prices of the period.
Practical Example
Let’s say you see a green candle that closes near its maximum. This could indicate that the cryptocurrency is in an upward trend. Conversely, if you see a red candle that closes near its minimum, it might signal weakness.
Market Trends
Understanding market trends is essential. Trends can be:
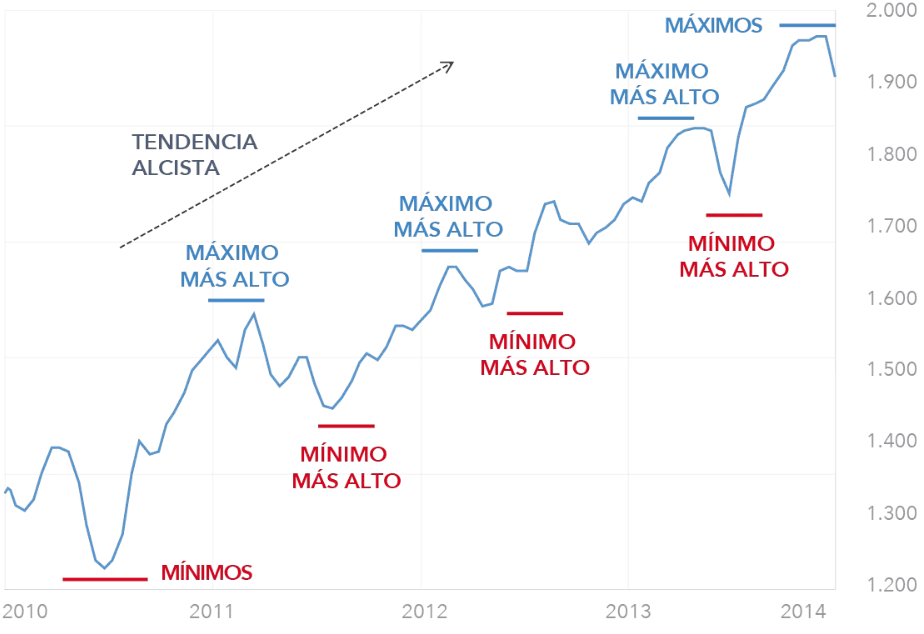
- Bullish: When prices are rising.
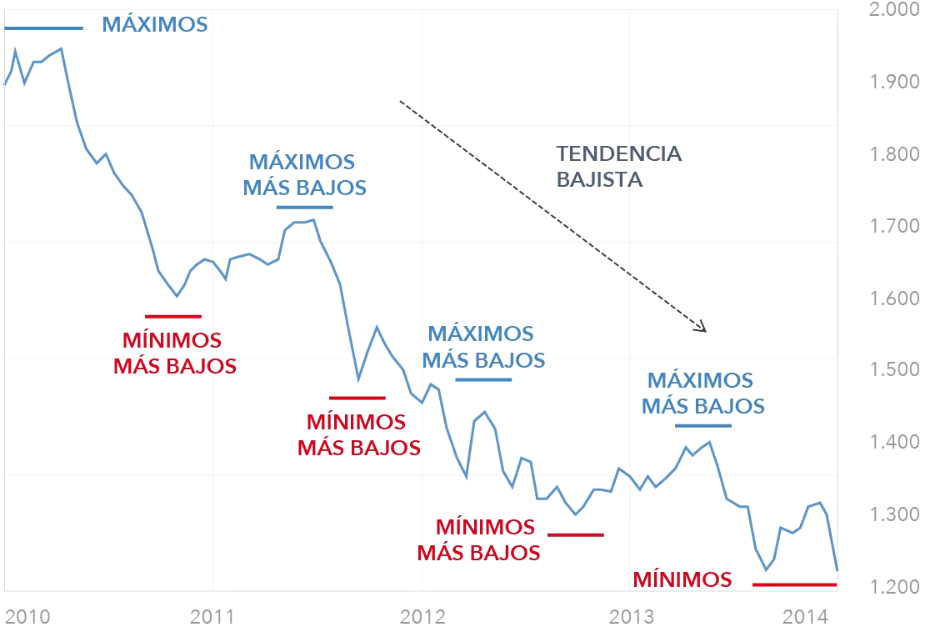
- Bearish: When prices are falling.
- Sideways: When prices remain within a range.
Identifying Trends
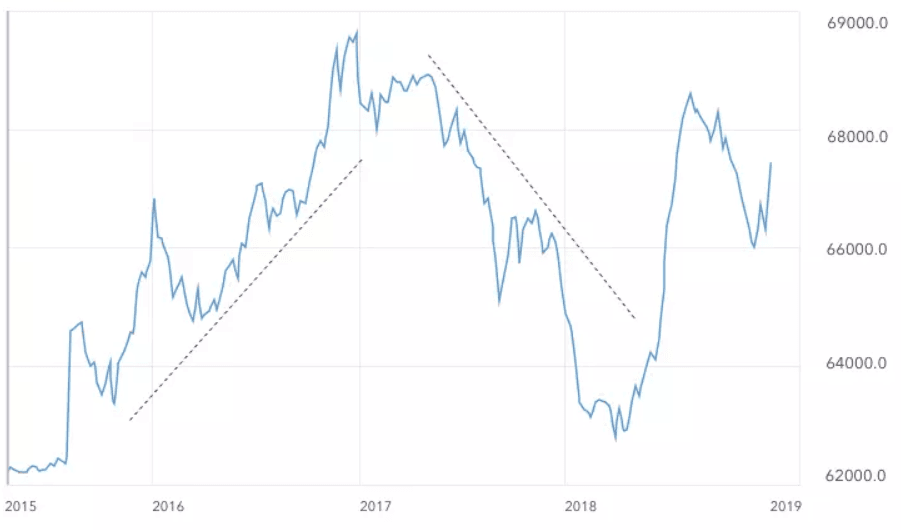
You can identify trends by observing the peaks and valleys in the charts. In a bullish trend, you will see higher peaks and higher valleys. In a bearish trend, peaks and valleys will be progressively lower.
Tools and Resources
There are various tools and platforms where you can view crypto charts, such as:
- TradingView: Offers interactive charts and many analysis tools.
- CoinMarketCap: Displays prices and charts of multiple cryptocurrencies.
- Binance: Provides advanced charts for cryptocurrency trading.
Tips for Beginners
1. Practice: Use demo accounts to practice reading charts without risking real money.
2. Be Patient: Reading charts can take time. Don’t get frustrated if you don’t understand it immediately.
3. Research: Read articles, watch videos, and follow experts on social media to improve your skills.
Conclusion
Learning to read crypto charts is a crucial step for any beginner in the world of cryptocurrencies. With practice and dedication, you can interpret these charts and make more informed decisions about your investments. Remember, knowledge is power, and in the world of cryptocurrencies, you never stop learning! So, are you ready to start your journey into the exciting world of cryptocurrencies?
